Greater Palm Springs Market Report, August 2018
Donna Ambrose September 29, 2018
Donna Ambrose September 29, 2018
Trendvision’s® most recent report shows that the Number of Homes Sold increased on average (+5%) for mid-range homes priced $500,000 to $999,999, while homes priced Up to $499,999, decreased in sales by (-8%), homes priced 1M+ by (-19%).
While this seems significant, the fact is that homes are still selling, and there are other market forces at play that provide a better indicator of the health of the Coachella Valley Real Estate market.

The market data that really counts, Average Sold Price, Number of Homes for Sale, and Number of Days on Market, offer us better insight into the underpinnings of the Palm Springs area real estate market and, its overall health. It also gives us a better perspective on where the market may be headed.
All three of these indices reveal that as in the past eight months, on average, there are still fewer homes on the market, and the ones that are, sell quicker and at higher prices compared to August a year ago.
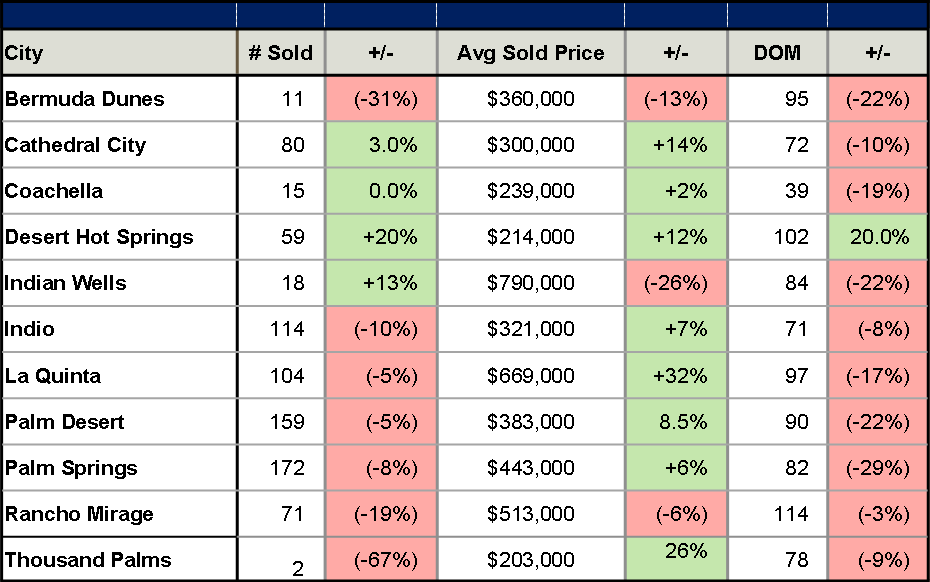
For the most part, as indicated above, the Number of Homes Sold in August 2018 vs. August 2017 were down in all cities EXCEPT, Cathedral City, up (+3%), and Indian Wells, up (+13%), and Desert Hot Springs, up (+20%).
When it comes to Average Sold Price, La Quinta stood out with a whopping (+32%) increase over last August solds, and Thousand Palms prices increased (+26%). Cathedral City and Desert Hot Springs increased by double digits. Only Indian Wells, Bermuda Dunes and Rancho Mirage experienced decreases in sold price percentages.
The Number of Days on Market decreased for every city, EXCEPT Desert Hot Springs. Double-digit percentage decreases, as high as (-29%) for Palm Springs, (-22%) for Bermuda Dunes, Indian Wells and Palm Desert. Coachella and La Quinta sold homes quicker by (-19%) and, (-17%).
Stay up to date on the latest real estate trends.

Donna Ambrose has joined the fastest-growing real estate brokerage in Southern California.
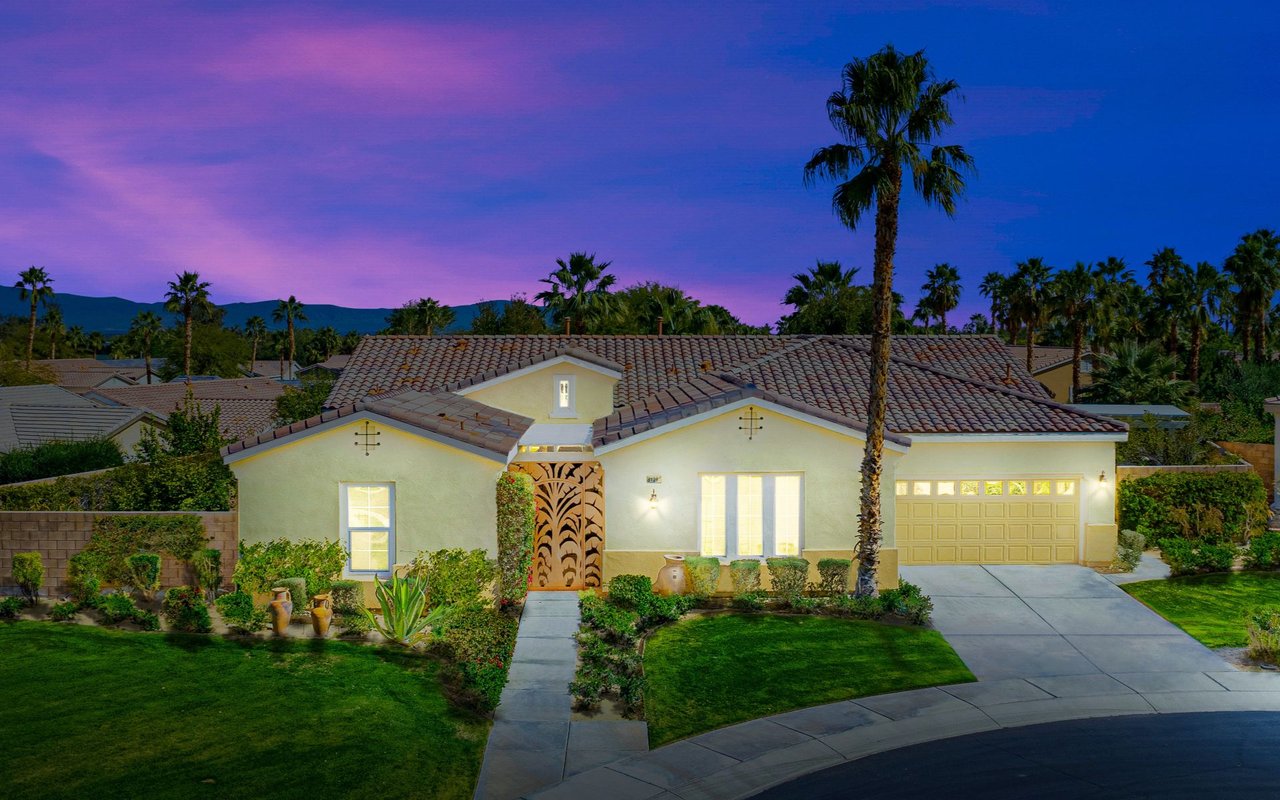
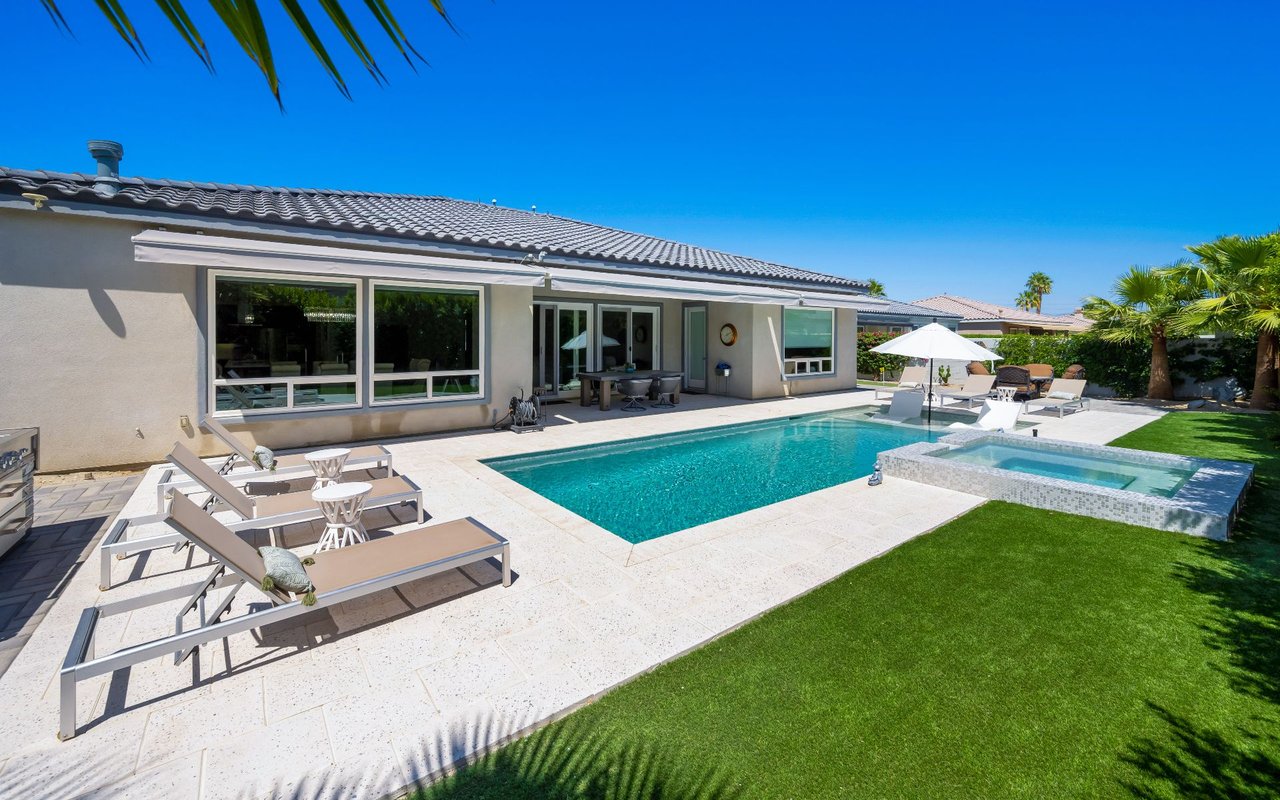
The home is light and bright with ten-foot ceilings and large windows overlooking the private backyard.
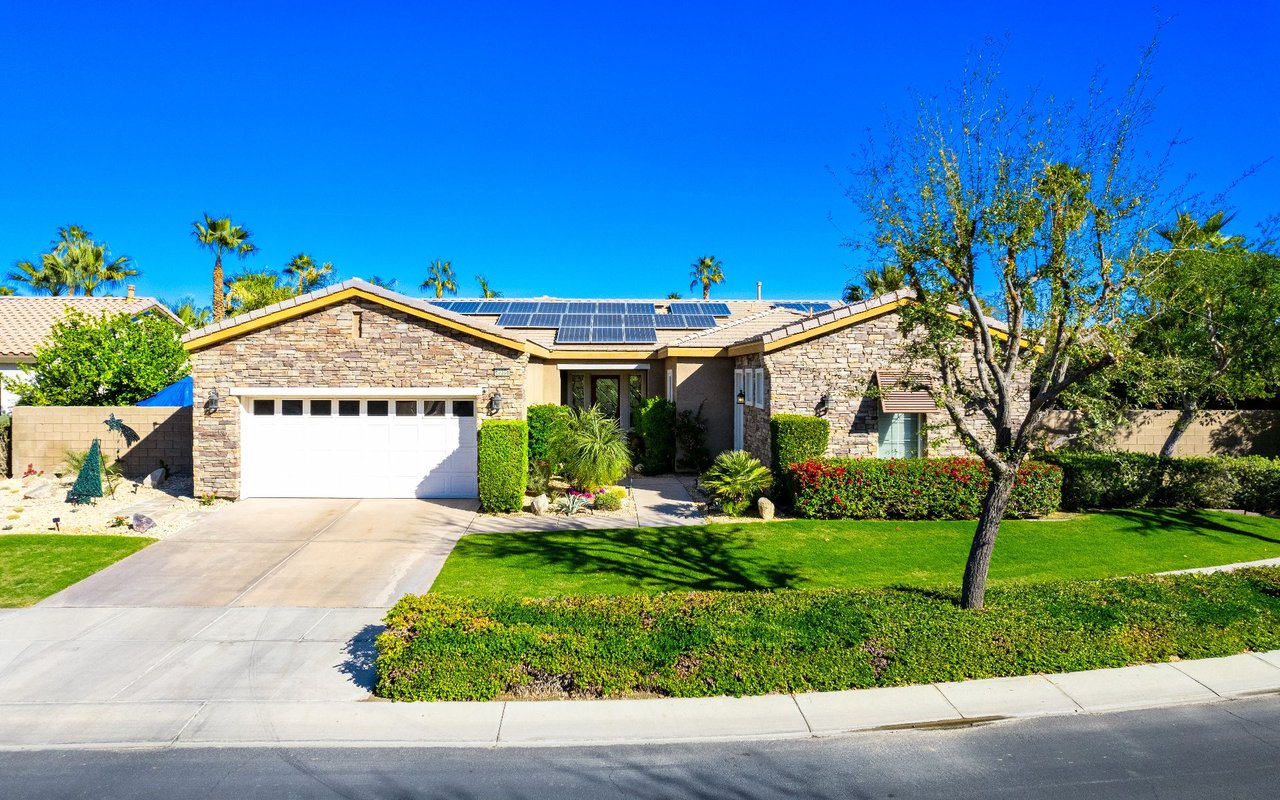
Our great appreciation and thank you very much for all the extra efforts you gave to complete our sale.
Get assistance in determining current property value, crafting a competitive offer, writing and negotiating a contract, and much more. Contact me today.